Reports
Introduction
Reports are available on the Business and Enterprise plans. They offer a visual representation of how your projects are progressing, through burn-up charts and pie charts at project and user levels.
Permissions
The Reports page is accessible to users who are part of Freedcamp's Business or Enterprise plan, either by being a subscriber or by being invited to a subscriber's projects.
Example: Report 'A' contains 10 projects. A user invited to only two of these projects will see only 2 projects in this report, even though there are more projects in it.
In order to create a report for a project, a user must be at least a project administrator in that project.
Example: If a user is a project administrator in 2 projects in a project group containing 10 projects - he/she will only be able to create a report containing these 2 projects.
A report can only be deleted by the user who created it, or the user who owns all the projects in the report.
Creating reports
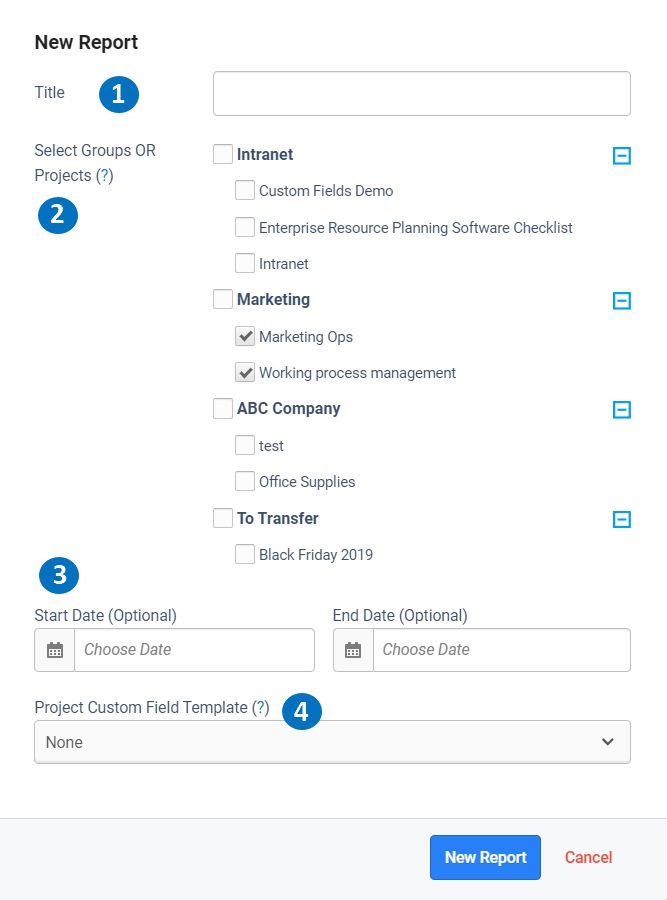
You can access the Reports page by clicking on the last icon in the top menu. To create a report, click on the New Report button in the top-right of the page.
It’s mandatory that you add a title(1) and select at least one project(2). If you select a group, then all future projects created in that group will be added to the report.
Dates are optional(3). If no dates are selected, we manually calculate the earliest and latest date based on the tasks in those projects.
If you are on the Enterprise plan and created Project Custom Fields Templates, you will be able to select one template (4) to be shown in the Summary section of the report. You can also select which fields to show.
What reports contain
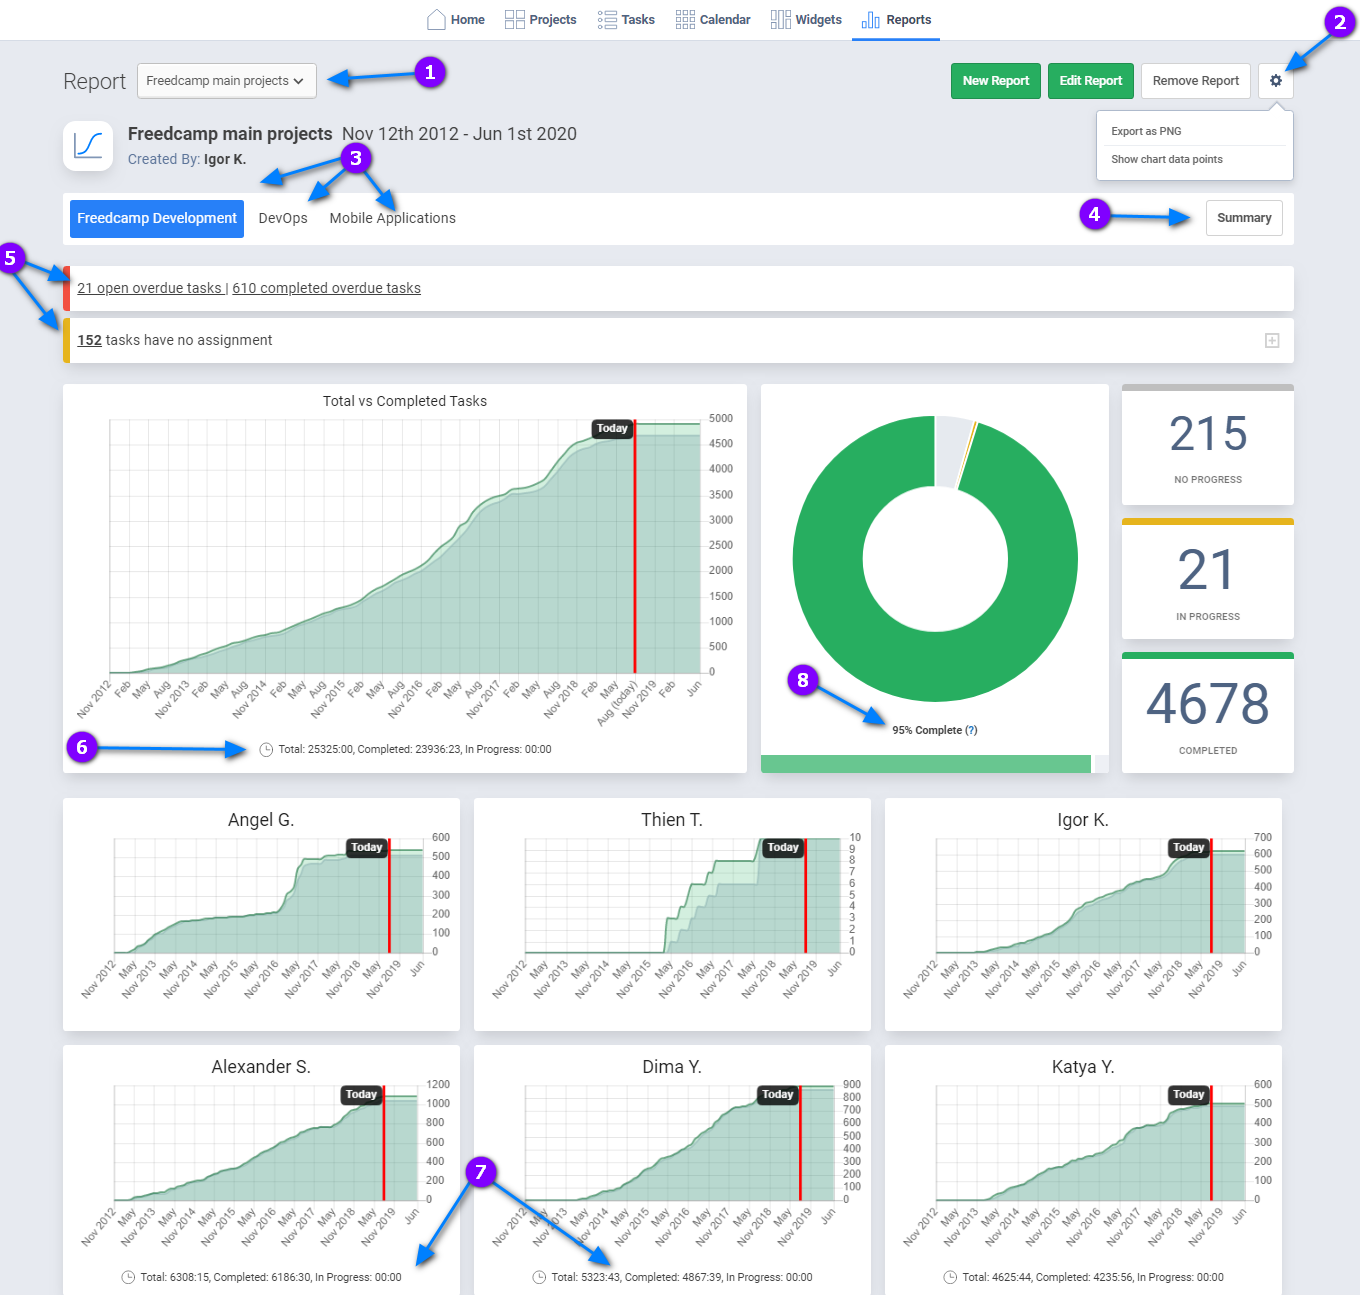
The reports menu (1) lets you choose which report you want to see.
The settings menu (2) allows you to export the selected report as PNGor XLS and enable chart data points.
You can choose to see a report for each project (3), or a summary of all the projects included in that report (4) - see the next section for more information.
Before the charts, we show you how many tasks in those projects are past their due date, how many have been completed after the deadline, and how many aren’t assigned to anybody (5).
The first burn-up chart (6) shows you created tasks, and completed tasks.
The next burn-up charts (7) show created and completed tasks as well, but for each individual user in your projects.
You can also see a project status in the form of a pie chart (8).
Sort order to users' charts is by the number of completed tasks to show top contributors above.
Reports will work if you only use Time Tracking in your projects but not Tasks or you have project contributors who only track time but have no tasks to complete. In such cases only tracked time will be shown.
Summary
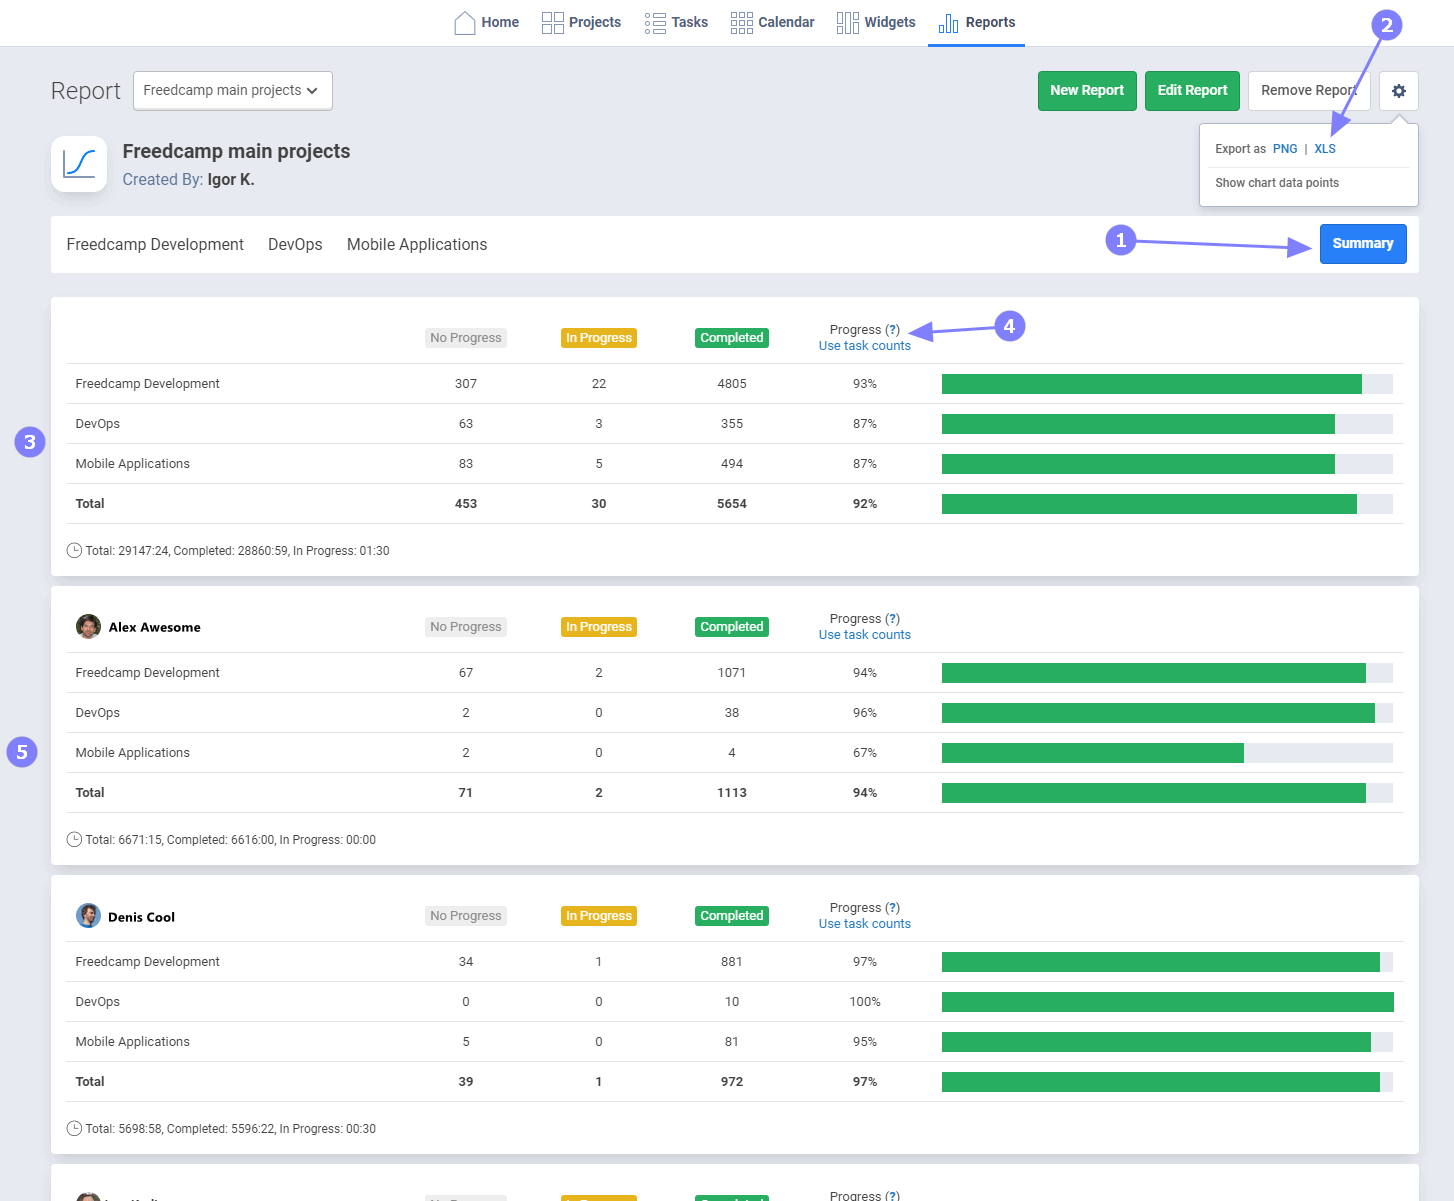
Summary (1) - see above, displays each included project status (3), allows to switch between two methods of calculation of project progress and contains individual sections for each team member involved in selected report projects (5).
On the Enterprise plan, the Summary section can also show Project Custom Field Templates.
How project progress is calculated
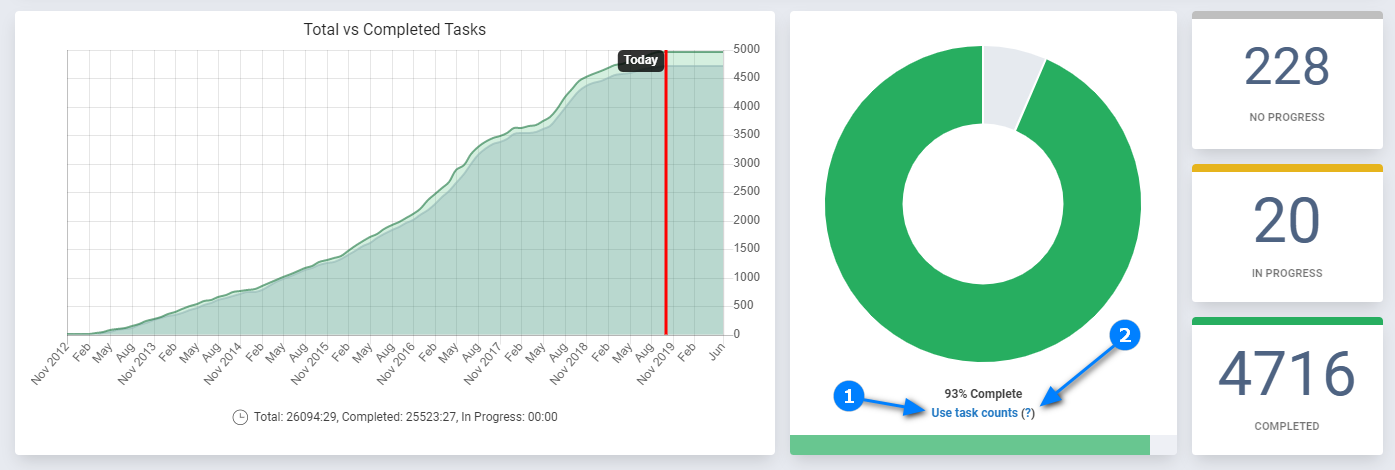
Freedcamp reports provide two ways to see project completion - simple and based on durations. Default is a more precise method based on durations. Click (1) to switch to a simple method or (2) to get back to this section in documentation from a report.
Simple count - if 5 out of 10 tasks are completed a project will be considered 50%. If a project has 10 tasks, 5 completed and 5 in progress, a project completion percentage would be calculated as 75% because 'In Progress' tasks with this method are considered 50% completed.
Durations approach takes into account:
- the percentage set for a task by a user in the Gantt view
- if the percentage is not set by a user a task is considered 50% for In Progress tasks, 0% - No Progress and 100% for Completed.
- durations are only taken into account for tasks with start and end dates set. Duration is not stretched for overdue tasks - they must be rescheduled to reflect a proper duration. All tasks with start date only or due date only or neither date set are always considered 1-day tasks.
Duration calculation takes into account the tasks duration described above and the percentage of each task completion to calculate the more precise percentage of completion of a project than the simple count approach.
For example, the first approach will consider a project with two tasks - one-day task (completed) and 9-days task (No Progress) as 50% completed.